QQE MOD + SSL Hybrid + Waddah Attar Explosion IndicatorINDICATOR PURPOSE
This indicator is designed to complement my original QQE MOD + SSL Hybrid + Waddah Attar Explosion strategy.
Multiple users have requested that I convert the strategy to an indicator because alertconditions do not work on strategies and people want to specific set alerts for BUY, SELL, CLOSE BUY and CLOSE SELL. This can only be achieved using alertcondition().
This indicator functions in the exact same way as the strategy, but it doesn't have any backtesting functionality. I recomment that you use the original QQE MOD + SSL Hybrid + Waddah Attar Explosion strategy for parameter tuning and backtesting, then if you need more control on alerts you can use this indicator for that purpose.
Only other difference is that I have added grey exit labels on the chart since it's not obvious where the exits would happen like it was in the strategy version.
CREDITS
QQE MOD byMihkel00
SSL Hybrid by Mihkel00
Waddah Attar Explosion by shayankm
Cari dalam skrip untuk "buy sell"

Saty Volume StackBreaks volume into buy and sell volume and stacks them based on which side has higher volume.
Dynamic Buy / Sell Stack
Unlike other buy/sell volume indicators, which statically display this information (typically green over red), this indicator dynamically stacks the higher volume side on top. For example, green over red indicates more buy-side volume, red over green indicators more sell-side volume.
Current Candle Volume Buy/Sell %
A label shows the % buy vs sell volume for the current candle in real-time. This label is also dynamic with the left position being higher volume.
How the Buy/Sell Volume is Calculated
Buy/Sell % is calculated based on price.
Buy % is calculated using the distance between the low of the candle to the closing value of the candle and dividing that by the total range of the candle high to low.
Sell % is calculated using the distance between the high of the candle to the closing value of the candle and dividing that by the total range of the candle high to low.
Please note this is a proxy metric and while it is incredibly useful, it is not going to match up exactly with actual buy/sell volume that can be found on tape.

BreakoutTrendFollowingINFO:
The "BreakoutTrendFollowing" indicator is a comprehensive trading system designed for trend-following in various market environments. It combines multiple technical indicators, including Moving Averages (MA), MACD, and RSI,
along with volume analysis and breakout detection from consolidation, to identify potential entry points in trending markets. This strategy is particularly effective for assets that exhibit strong trends and significant price movements.
Note that using the consolidation filter reduces the amount of entries the strategy detects significantly, and needs to be used if we want to have an increased confidence in the trend via breakout.
However, the strategy can be easily transformed to various only trend-following strategies, by applying different filters and configurations.
The indicator can be used to connect to the Signal input of the TTS (TempalteTradingStrategy) by jason5480 in order to backtest it, thus effectively turning it into a strategy (instructions below in TTS CONNECTIVITY section)
DETAILS:
The strategy's core is built upon several key components:
Moving Average (MA): Used to determine the general trend direction. The strategy checks if the price is above the selected MA type and length.
MACD Filter: Analyzes the relationship between two moving averages to confirm the trend's momentum.
Consolidation Detection: Identifies periods of price consolidation and triggers trades on breakouts from these ranges.
Volume Analysis: Assesses trading volume to confirm the strength and validity of the breakout.
RSI: Used to avoid overbought conditions, ensuring trades are entered in favorable market situations.
Wick filters: make sure there is not a long wick that indicates selling pressure from above
The strategy generates buy signals when several conditions are met concurrently (each one of them can be individually enabled/disabled)"
The price is above the selected MA.
A breakout occurs from a configurable consolidation range.
The MACD line is above the signal line, indicating bullish momentum.
The RSI is below the overbought threshold.
There's an increase in trading volume, confirming the breakout's strength.
Currently the strategy fires SL signals, as the approach is to check for loss of momentum - i.e. crossunder of the MACD line and signal line, but that is to everyone to determine the exit conditions.
The buy and SL signals are set on the chart using green or orange triangles on the below/above the price action.
SETTINGS:
Users can customize various parameters, including MA type and period, MACD settings, consolidation length, and volume increase percentage. The strategy is equipped with alert conditions for both entry (buy signals) and exit (set stop loss) points, facilitating both manual and automated trading.
Each one of the technical indicators, as well as the consilidation range and breakout/wick settings can be configured and enabled/disabled individually.
Please thoroughly review the available settings of the script, but here is an outline of the most important ones:
Use bar wicks (instead of open/close) - the ref_high/low will be taken based on the bar wicks, rather than the open/close when determining the breakout and MA
Enter position only on green candles - additional filters to make sure that we enter only on strong momentum
MA Filter: (enable, source, type, length) - general settings for MA filter to be checked against the stock price (close or upper wick)
MACD Filter: (enable, source, Osc MA type, Signal MA type, Fast MA length, Slow MA length, Low MACD Hist) - detailed settings for fine MACD tuning
Consolidation:
Consolidation Type: we have two different ways of detecting the consolidation, note the types below.
CONSOLIDATION_BASIC - consolidation areas by looking for the pivot point of a trend and counts the number of bars that have not broken the consolidation high/low levels.
CONSOLIDATIO_RANGE_PERCENT - identifies consolidation by comparing the range between the highest and lowest price points over a specified period.
So in summary the CONSOLIDATIO_RANGE_PERCENT uses a percentage-based range to define consolidation, while CONSOLIDATION_BASIC uses a count of bars within a high-low range to establish consolidation.
Thus the former is more focused on the tightness of the price range, whereas the latter emphasizes the duration of the consolidation phase.
The CONSOLIDATIO_RANGE_PERCENT might be more sensitive to recent price movements and suitable for shorter-term analysis, while CONSOLIDATION_BASIC could be better for identifying longer-term consolidation patterns.
Min consolidation length - applicable for CONSOLIDATION_BASIC case, the min number of bars for the price to be in the range to consider consolidation
Consolidation Loopback period - applicable for CONSOLIDATION_BASIC case, the loopback number of bars to look for consolidation
Consolidation Range percent - applicable for CONSOLIDATIO_RANGE_PERCENT, the percent between the high and low in the range to consider consolidation
Plot consolidation - enables plotting of the consolidation (only for debug purposes)
Breakout: (enable, low, high) - the definition of the breakout from the previous consolidation range, the price should be between to determine the breakout as successfull
Upper wick: (enable, percent) - defines the percent of the upper wick compared to the whole candle to allow breakout (if the wick is too big part of the candle we can consider entering the position riskier)
RSI: (enable, length, overbought) - general settings for RSI TA
Volume (enbale, percentage increase, average volume filter en, loopback bars) - percentage of increase of the volume to consider for a breakout. There are two modes - percentage increase compared to the previous bar, or percentage against the average volume for the last loopback bars.
Note that there are many different configuration that you can play with, and I believe this is the strength of the strategy, as it can provide a single solution for different cases and scenarios.
My advice is to try and play with the different options for different markets based on the approach you want to implement and try turning features on/off and tuning them further.
TTS SETTINGS (NEEDED IF USED TO BACKTEST WITH TTS):
The TempalteTradingStrategy is a strategy script developed in Pine by jason5480, which I recommend for quick turn-around of testing different ideas on a proven and tested framework
I cannot give enough credit to the developer for the efforts put in building of the infrastructure, so I advice everyone that wants to use it first to get familiar with the concept and by checking
by checking jason5480's profile www.tradingview.com
The TTS itself is extremely functional and have a lot of properties, so its functionality is beyond the scope of the current script -
Again, I strongly recommend to be thoroughly explored by everyone that plans on using it.
In the nutshell it is a script that can be feed with buy/sell signals from an external indicator script and based on many configuration options it can determine how to execute the trades.
The TTS has many settings that can be applied, so below I will cover only the ones that differ from the default ones, at least according to my testing - do your own research, you may find something even better :)
The current/latest version that I've been using as of writing and testing this script is TTSv48
Settings which differ from the default ones:
Deal Conditions Mode - External (take enter/exit conditions from an external script)
🔌Signal 🛈➡ - BreakoutTrendFollowing: 🔌Signal to TTS (this is the output from the indicator script, according to the TTS convention)
Order Type - STOP (perform stop order)
Distance Method - HHLL (HigherHighLowerLow - in order to set the SL according to the strategy definition from above)
The next are just personal preferences, you can feel free to experiment according to your trading style
Take Profit Targets - 0 (either 100% in or out, no incremental stepping in or out of positions)
Dist Mul|Len Long/Short- 10 (make sure that we don't close on profitable trades by any reason)
Quantity Method - EQUITY (personal backtesting preference is to consider each backtest as a separate portfolio, so determine the position size by 100% of the allocated equity size)
Equity % - 100 (note above)

SILVER Midnight Candle Color Strategy 1-Hour Delay and SL/TP Overview:
The "Midnight Candle Color Strategy with 1-Hour Delay and SL/TP" is a unique trading strategy designed for the Forex market. This strategy capitalizes on the color of the midnight candle based on New York time, making trade decisions one hour later, at 1:00 AM.
Key Features:
Time Zone Adjustment: Automatically adjusts to New York time (UTC-5 or UTC-4 during Daylight Saving Time).
Midnight Candle Analysis: Utilizes the color of the midnight candle to gauge market sentiment.
Trade Execution at 1 AM: Trades are executed one hour after midnight based on the previous day's candle color.
Strategic SL/TP: Incorporates predefined stop loss (SL) and take profit (TP) levels for each trade.
How It Works:
The script first determines whether the current bar represents 12:00 AM or 1:00 AM in New York time.
At midnight, it records the color of the candle (green for bullish, red for bearish).
At 1:00 AM, the strategy:
Enters a long position if the midnight candle was green, with specific TP and SL settings.
Enters a short position if the midnight candle was red, again with defined TP and SL.
Visualization:
Optional markers are plotted on the chart for easy visualization of the strategy's entry points at midnight and 1 AM.
Usage Tips:
Ideal for traders focusing on overnight price movements and early morning trends.
Best suited for SILVER trading due to the 24-hour trading cycle.
We recommend backtesting the strategy with historical data to evaluate performance.
Disclaimer:
This strategy is provided for educational purposes and should not be considered as financial advice. Users should conduct their own research and exercise caution while trading. Past performance is not indicative of future results.
I´m not a signal service, however I´m sharing my signals. For free. If you wish to buy something, contact some other signalist, preferably with 5-10-15-20K followers, selling signals on the premium channel, but in reality not trading them themselves. If you will realise after few blown account that something is wrong, ask yourself why is that. Trading is not pushing the buy-sell button and drinking tequila on the beach. If you want to learn, you know what to do.

Advanced Dynamic Threshold RSI [Elysian_Mind]Advanced Dynamic Threshold RSI Indicator
Overview
The Advanced Dynamic Threshold RSI Indicator is a powerful tool designed for traders seeking a unique approach to RSI-based signals. This indicator combines traditional RSI analysis with dynamic threshold calculation and optional Bollinger Bands to generate weighted buy and sell signals.
Features
Dynamic Thresholds: The indicator calculates dynamic thresholds based on market volatility, providing more adaptive signal generation.
Performance Analysis: Users can evaluate recent price performance to further refine signals. The script calculates the percentage change over a specified lookback period.
Bollinger Bands Integration: Optional integration of Bollinger Bands for additional confirmation and visualization of potential overbought or oversold conditions.
Customizable Settings: Traders can easily customize key parameters, including RSI length, SMA length, lookback bars, threshold multiplier, and Bollinger Bands parameters.
Weighted Signals: The script introduces a unique weighting mechanism for signals, reducing false positives and improving overall reliability.
Underlying Calculations and Methods
1. Dynamic Threshold Calculation:
The heart of the Advanced Dynamic Threshold RSI Indicator lies in its ability to dynamically calculate thresholds based on multiple timeframes. Let's delve into the technical details:
RSI Calculation:
For each specified timeframe (1-hour, 4-hour, 1-day, 1-week), the Relative Strength Index (RSI) is calculated using the standard 14-period formula.
SMA of RSI:
The Simple Moving Average (SMA) is applied to each RSI, resulting in the smoothing of RSI values. This smoothed RSI becomes the basis for dynamic threshold calculations.
Dynamic Adjustment:
The dynamically adjusted threshold for each timeframe is computed by adding a constant value (5 in this case) to the respective SMA of RSI. This dynamic adjustment ensures that the threshold reflects changing market conditions.
2. Weighted Signal System:
To enhance the precision of buy and sell signals, the script introduces a weighted signal system. Here's how it works technically:
Signal Weighting:
The script assigns weights to buy and sell signals based on the crossover and crossunder events between RSI and the dynamically adjusted thresholds. If a crossover event occurs, the weight is set to 2; otherwise, it remains at 1.
Signal Combination:
The weighted buy and sell signals from different timeframes are combined using logical operations. A buy signal is generated if the product of weights from all timeframes is equal to 2, indicating alignment across timeframe.
3. Experimental Enhancements:
The Advanced Dynamic Threshold RSI Indicator incorporates experimental features for educational exploration. While not intended as proven strategies, these features aim to offer users a glimpse into unconventional analysis. Some of these features include Performance Calculation, Volatility Calculation, Dynamic Threshold Calculation Using Volatility, Bollinger Bands Module, Weighted Signal System Incorporating New Features.
3.1 Performance Calculation:
The script calculates the percentage change in the price over a specified lookback period (variable lookbackBars). This provides a measure of recent performance.
pctChange(src, length) =>
change = src - src
pctChange = (change / src ) * 100
recentPerformance1H = pctChange(close, lookbackBars)
recentPerformance4H = pctChange(request.security(syminfo.tickerid, "240", close), lookbackBars)
recentPerformance1D = pctChange(request.security(syminfo.tickerid, "1D", close), lookbackBars)
3.2 Volatility Calculation:
The script computes the standard deviation of the closing price to measure volatility.
volatility1H = ta.stdev(close, 20)
volatility4H = ta.stdev(request.security(syminfo.tickerid, "240", close), 20)
volatility1D = ta.stdev(request.security(syminfo.tickerid, "1D", close), 20)
3.3 Dynamic Threshold Calculation Using Volatility:
The dynamic thresholds for RSI are calculated by adding a multiplier of volatility to 50.
dynamicThreshold1H = 50 + thresholdMultiplier * volatility1H
dynamicThreshold4H = 50 + thresholdMultiplier * volatility4H
dynamicThreshold1D = 50 + thresholdMultiplier * volatility1D
3.4 Bollinger Bands Module:
An additional module for Bollinger Bands is introduced, providing an option to enable or disable it.
// Additional Module: Bollinger Bands
bbLength = input(20, title="Bollinger Bands Length")
bbMultiplier = input(2.0, title="Bollinger Bands Multiplier")
upperBand = ta.sma(close, bbLength) + bbMultiplier * ta.stdev(close, bbLength)
lowerBand = ta.sma(close, bbLength) - bbMultiplier * ta.stdev(close, bbLength)
3.5 Weighted Signal System Incorporating New Features:
Buy and sell signals are generated based on the dynamic threshold, recent performance, and Bollinger Bands.
weightedBuySignal = rsi1H > dynamicThreshold1H and rsi4H > dynamicThreshold4H and rsi1D > dynamicThreshold1D and crossOver1H
weightedSellSignal = rsi1H < dynamicThreshold1H and rsi4H < dynamicThreshold4H and rsi1D < dynamicThreshold1D and crossUnder1H
These features collectively aim to provide users with a more comprehensive view of market dynamics by incorporating recent performance and volatility considerations into the RSI analysis. Users can experiment with these features to explore their impact on signal accuracy and overall indicator performance.
Indicator Placement for Enhanced Visibility
Overview
The design choice to position the "Advanced Dynamic Threshold RSI" indicator both on the main chart and beneath it has been carefully considered to address specific challenges related to visibility and scaling, providing users with an improved analytical experience.
Challenges Faced
1. Differing Scaling of RSI Results:
RSI values for different timeframes (1-hour, 4-hour, and 1-day) often exhibit different scales, especially in markets like gold.
Attempting to display these RSIs on the same chart can lead to visibility issues, as the scaling differences may cause certain RSI lines to appear compressed or nearly invisible.
2. Candlestick Visibility vs. RSI Scaling:
Balancing the visibility of candlestick patterns with that of RSI values posed a unique challenge.
A single pane for both candlesticks and RSIs may compromise the clarity of either, particularly when dealing with assets that exhibit distinct volatility patterns.
Design Solution
Placing the buy/sell signals above/below the candles helps to maintain a clear association between the signals and price movements.
By allocating RSIs beneath the main chart, users can better distinguish and analyze the RSI values without interference from candlestick scaling.
Doubling the scaling of the 1-hour RSI (displayed in blue) addresses visibility concerns and ensures that it remains discernible even when compared to the other two RSIs: 4-hour RSI (orange) and 1-day RSI (green).
Bollinger Bands Module is optional, but is turned on as default. When the module is turned on, the users can see the upper Bollinger Band (green) and lower Bollinger Band (red) on the main chart to gain more insight into price actions of the candles.
User Flexibility
This dual-placement approach offers users the flexibility to choose their preferred visualization:
The main chart provides a comprehensive view of buy/sell signals in relation to candlestick patterns.
The area beneath the chart accommodates a detailed examination of RSI values, each in its own timeframe, without compromising visibility.
The chosen design optimizes visibility and usability, addressing the unique challenges posed by differing RSI scales and ensuring users can make informed decisions based on both price action and RSI dynamics.
Usage
Installation
To ensure you receive updates and enhancements seamlessly, follow these steps:
Open the TradingView platform.
Navigate to the "Indicators" tab in the top menu.
Click on "Community Scripts" and search for "Advanced Dynamic Threshold RSI Indicator."
Select the indicator from the search results and click on it to add to your chart.
This ensures that any future updates to the indicator can be easily applied, keeping you up-to-date with the latest features and improvements.
Review Code
Open TradingView and navigate to the Pine Editor.
Copy the provided script.
Paste the script into the Pine Editor.
Click "Add to Chart."
Configuration
The indicator offers several customizable settings:
RSI Length: Defines the length of the RSI calculation.
SMA Length: Sets the length of the SMA applied to the RSI.
Lookback Bars: Determines the number of bars used for recent performance analysis.
Threshold Multiplier: Adjusts the multiplier for dynamic threshold calculation.
Enable Bollinger Bands: Allows users to enable or disable Bollinger Bands integration.
Interpreting Signals
Buy Signal: Generated when RSI values are above dynamic thresholds and a crossover occurs.
Sell Signal: Generated when RSI values are below dynamic thresholds and a crossunder occurs.
Additional Information
The indicator plots scaled RSI lines for 1-hour, 4-hour, and 1-day timeframes.
Users can experiment with additional modules, such as machine-learning simulation, dynamic real-life improvements, or experimental signal filtering, depending on personal preferences.
Conclusion
The Advanced Dynamic Threshold RSI Indicator provides traders with a sophisticated tool for RSI-based analysis, offering a unique combination of dynamic thresholds, performance analysis, and optional Bollinger Bands integration. Traders can customize settings and experiment with additional modules to tailor the indicator to their trading strategy.
Disclaimer: Use of the Advanced Dynamic Threshold RSI Indicator
The Advanced Dynamic Threshold RSI Indicator is provided for educational and experimental purposes only. The indicator is not intended to be used as financial or investment advice. Trading and investing in financial markets involve risk, and past performance is not indicative of future results.
The creator of this indicator is not a financial advisor, and the use of this indicator does not guarantee profitability or specific trading outcomes. Users are encouraged to conduct their own research and analysis and, if necessary, consult with a qualified financial professional before making any investment decisions.
It is important to recognize that all trading involves risk, and users should only trade with capital that they can afford to lose. The Advanced Dynamic Threshold RSI Indicator is an experimental tool that may not be suitable for all individuals, and its effectiveness may vary under different market conditions.
By using this indicator, you acknowledge that you are doing so at your own risk and discretion. The creator of this indicator shall not be held responsible for any financial losses or damages incurred as a result of using the indicator.
Kind regards,
Ely

Noa: Z-distance from VWAP with Kalman Smoother
Title: Noa: Z-distance from VWAP with Kalman Smoother
Description:
The "Z-distance from VWAP with Kalman Smoother" is a tool constructed on the premise that price evolves in distinct stages: normal or extreme trends (upward or downward) and transitional periods, termed as 'flips'. The Volume Weighted Average Price (VWAP) serves as a benchmark, representing the market's expectation of a fair value over a given time frame. However, since each stock trades on its unique price scale, direct comparisons are not feasible. This script introduces a standardized method, using the Z-score from the VWAP, to understand and compare these relationships across diverse scales.
Core Principles:
Stages of Price Movement:
- Prices don't move purely randomly; while they contain a random element, they oscillate in discernible patterns or stages—either maintaining a trend (normal or extreme) or undergoing transition (flip).
- VWAP as Fair Value: VWAP offers a dynamic representation of what the market perceives as fair value for a stock over a specific period.
- Standardizing Price Relations: Given the varied scales at which different stocks trade, a model was imperative to standardize these relations. The Z-score from the VWAP fulfills this role, offering a normalized measure of how far the price deviates from its perceived fair value.
Features:
Z-score Levels:
The indicator demarcates various stages of price movements, offering clarity on potential overbought or oversold conditions.
- Extreme Up Trend: Indicated when the Z-score surpasses the upper limit.
- Normal Up Trend: Represented when the Z-score lies between the flip upper and the upper limit.
- Transition (Flip): Recognized when the Z-score oscillates within the flip range.
- Normal Down Trend: Denoted when the Z-score is between the flip lower and the lower limit.
- Extreme Down Trend: Marked when the Z-score falls below the lower limit.
Visual Aids:
- Color-coded regions between specific Z-score levels and the Z-score plot itself elucidate the current market state.
- Kalman Filter: By incorporating a Kalman filter, the indicator offers a less noisy and smoother representation of the Z-score, enhancing its interpretability.
Usage:
Trend Analysis:
- The Z-score states and the color-coded plot facilitate a nuanced understanding of the prevailing market trend.
- Potential Reversal Points: Extremely positive or negative Z-scores might hint at impending reversals.
- Buy/Sell Signals: Z-score's interactions with the flip level can be interpreted as potential trading signals.
Example (for illustration purposes only):
AAPL since April 2022: The stock exited from a normal uptrend and transitioned potentially towards a downtrend. By the end of April, AAPL flipped twice before transitioning to a normal downtrend. By early May, the stock moved into an aggressive downtrend. Market buyers were able to counter this downtrend by June, but selling pressure persisted, pushing the stock back into an aggressive downtrend. By the end of June, buyers halted the aggressive selling and transitioned the stock from an aggressive to normal downtrend, then to a flip, and finally to a normal uptrend by the end of August. AAPL briefly peaked into an aggressive uptrend before being pressured back to a normal downtrend. The rest of 2022 saw AAPL attempting several short-lived uptrend flips. However, 2023 brought a change, with AAPL flipping into a normal uptrend by the end of January, maintaining it until August of that year.
Credits:
This script, inspired by Z distance from VWAP by LazyBear and Kalman Smoother by alexgrover, was revamped and enriched by nord-ouestadvisors to embed these core principles and heighten its usability. A special acknowledgment to ChatGPT by OpenAI for the guidance.

Worm *Public*This Pine Script code is designed to create a custom technical indicator called "Worm" that helps identify trends in the market based on momentum. Let's break down the code and its settings:
Indicator Title and Overlay:
The indicator is named "Worm (Clean)" and is set to be overlaid on the price chart.
Input Settings:
The code defines various input settings, which can be customized by the user. These settings include:
Indicator Settings (e.g., Alpha, Gap)
Backtest Settings (e.g., HighlightCrossovers, ApplyNorm)
Color Settings (e.g., Buy Color, Sell Color, Wait Color)
Location Settings for displaying the indicator above, below, or at the price.
Toggleable Inputs:
These settings allow you to choose whether the momentum indicator should be displayed above, below, or at the price chart. You can also specify the colors for buy, sell, and wait signals.
Indicator Calculations:
The code calculates momentum using various formulas involving the source price data (e.g., open, high, low, close). Momentum values are stored in variables L0, L1, L2, L3, and lrsi.
It also calculates the Color values for the indicator based on certain conditions and user-defined settings.
Bcolor and Scolor are used to determine the color of the plotted indicator based on buy and sell conditions.
Bollinger Bands (BB) and Keltner Channels (KC) Calculation:
The code calculates Bollinger Bands (UpperBB and LowerBB) and Keltner Channels (UpperKC and LowerKC) using the source price data.
It also determines whether the market is in a squeeze (SqzOn) or not (NoSqz) based on the relationship between BB and KC.
Signal Generation:
Buy and sell signals are generated based on various conditions, including momentum values and the squeeze state.
The color of the indicator line is determined based on the buy and sell signals.
LagF Calculation:
The LagF variable is calculated based on certain formulas involving the L0Line, L1Line, L2Line, and L3Line values.
Control Color:
The Color variable is used to control the color of the LagF indicator line based on certain conditions.
Plotting:
The momentum indicator (Val) is plotted on the chart with the specified colors and style.
The LagF indicator (Worm) is also plotted with a dynamic color based on market conditions.
Alerts are triggered when buy or sell signals are generated.
Experimental Section:
This section appears to be left for experimentation and may contain additional code or features.
Overall, this Pine Script code calculates and displays a custom momentum-based indicator called "Worm" on a price chart. It generates buy and sell signals based on momentum and squeeze conditions and allows users to customize various settings, including indicator location and colors. The code is designed for technical analysis and trend identification in financial markets.

Blockchain FundamentalThis indicator is made for traders to harness fundamental blockchain data for better decision-making. Unlike traditional tools, this indicator doesn't depend on standard technical indicators. It offers a novel perspective by focusing on core blockchain metrics like capitalization, miner activity, and other intrinsic data elements. I've designed a distinct scoring logic, exclusive to BF, ensuring it's user-friendly and provides actionable insights for traders at all levels.
Mainly created for Bitcoin , but can be applied to any other crypto assets in cost of losing some metrics in the analysis.
Ethereum chart:
Features:
Customizable Moving Averages:
Choose from an array of moving averages, with the flexibility to adjust the length for a tailored analysis, aiding in pinpointing asset trends.
Blockchain Metrics Integration:
Incorporates a range of blockchain metrics such as Market Cap to Realised Cap ratio, Spent Output Profit Ratio, ATH Drawdown, and more.
Blockchain Metrics Evaluation:
Each metric can be toggled on/off to customize the analysis. Using default settings, traders can use all of the metrics combined.
Every metric is essentially evaluated on a scale from -100 to 100 and then combined with others. If any metric is uncertain about its direction (equals to 0), then the score of it is not accounted in a final calculation.
Kalman Filter:
This indicator offers the option to apply a Kalman filter to the signals, enhancing the smoothness and accuracy of the indicator’s output. This is my approach to mitigate the noise in the final output.
Signal Oscillator:
Displays the aggregated score of all selected blockchain metrics.
Offers visual signals with adjustable upper and lower bounds for easy interpretation based on particular asset observation.
Visual Elements:
Signal Oscillator:
A visual representation of the aggregated blockchain fundamental score.
(White line for a raw calculation, orange line for kalman-filtered one)
Signal Counter:
Displays the count of metrics currently being considered in the fundamental score calculation. (grey line at the middle of an indicator)
Buy/Sell Signal Coloring:
The background color changes to indicate potential buying or selling opportunities based on user-defined bounds.
Usage:
Analysis:
Use the signal oscillator to identify potential market tops and bottoms based on blockchain fundamental data.
Adjust the bounds to customize the sensitivity of buy/sell signals.
Customization:
Enable/disable specific blockchain metrics to tailor the indicator to your analytical needs.
Adjust the moving average type and length for better analysis.
Integration:
Combine with other technical indicators to create a comprehensive trading strategy.
Utilize in conjunction with volume and price action analysis for enhanced decision-making. Every output could be used in traders custom strategies and indicators.

Trend_Trader_WMA (Momentum)<---> Caution! This is first test version of indicator. I am ready to get more ideas+feedback to develop it more. <--->
The "Momentum_Trader_WMA" indicator is a versatile technical analysis tool designed to help traders identify potential trend changes and momentum shifts in the market. It combines multiple indicators and moving averages to provide a comprehensive view of price action and momentum.
Key Features:
Weighted Moving Averages (WMAs): The indicator calculates two different WMAs with user-defined lengths, providing a smoothed representation of price data.
Average True Range (ATR) Bands: ATR is used to calculate dynamic bands around the WMA Average. These bands can help traders gauge market volatility and potential breakout points. The color of the ATR bands can be seen as an early signal of trends or the continuation of current trends.
Commodity Channel Index (CCI): CCI is a momentum oscillator that measures the relative strength of price changes. The indicator calculates CCI values based on a user-defined period.
Exponential Moving Average (EMA) of CCI: An EMA of CCI is plotted to help identify trends and momentum shifts.
Color-Coded Bands: The ATR bands change colors based on CCI conditions, providing visual cues for potential trading opportunities. When ATR bands transition from narrow (indicating low volatility) to wide (indicating increased volatility), it can be seen as an early signal of a potential trend change or the continuation of the current trend.
Buy and Sell Signals: The indicator generates buy and sell signals based on crossovers of WMAs and CCI thresholds, making it easier for traders to identify entry and exit points.
Customizable Moving Averages: Traders can enable or disable different moving averages (e.g., SMA, EMA, WMA, RMA, VWMA, HMA) with various periods and colors to adapt the indicator to their trading preferences.
CCI Dot Alerts: Dots are displayed at the bottom of the chart based on CCI values, helping traders spot extreme CCI conditions.
How to Use:
Trend Identification: The WMAs and ATR bands can help identify the current trend direction and its strength. When the WMAs are in an uptrend (green) and the ATR bands widen, it may indicate a strong bullish trend. Conversely, when the WMAs are in a downtrend (red) and the ATR bands narrow, it may suggest a weakening bearish trend.
Momentum Confirmation: The CCI and its EMA provide insights into market momentum. Look for CCI crossovers above 100 for potential bullish momentum and below -100 for potential bearish momentum.
Buy and Sell Signals: Pay attention to the buy and sell signals generated by the indicator. Buy when the WMAs cross over and CCI crosses above 100. Sell when the WMAs cross under and CCI crosses below -100.
ATR Bands as Early Signals: The color changes in the ATR bands can be seen as early signals of trends or the continuation of current trends. Wide ATR bands may indicate increased volatility and potential trend changes, while narrow ATR bands suggest reduced volatility and potential trend continuation.
Moving Averages: Customize the indicator by enabling or disabling specific moving averages according to your preferred trading strategy.
CCI Dots: Use the CCI dots to identify extreme CCI conditions, which may indicate overbought or oversold market conditions.
PS:
Recommended to use Indicator with price action conecpts(eg. support and resistance) as they play important role in any market.
Buy and sell signals are not really accurate. I would personally look for trend shift in WMA middle line and confirmation from CCI dots at bottom. For example. If middle line turns green and within recent 3-4 candles (or next 3-4 candles) dots tunrns green also, that means momentum has been rised in the direction of bulls.
pls, take s/r concepts first when working. I am thinking to add more precise buy sell signal method to make it easier to trade.
Good luck with your trades :)

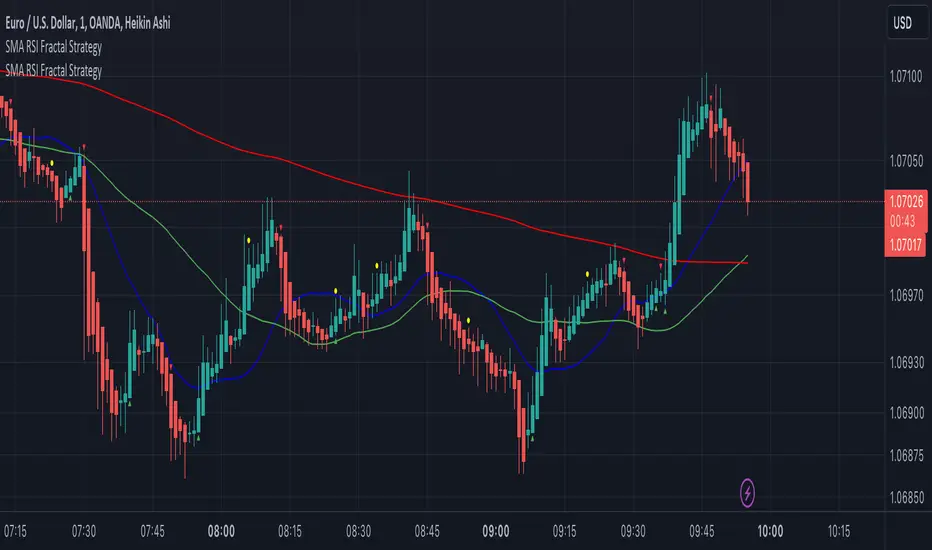
SMA RSI Fractal Entry & Exit PointsUsing the 20, 50, 200 SMA, RSI, and Fractals to indicate when to exit buy/sells or move SL if your not trailing to protect profits
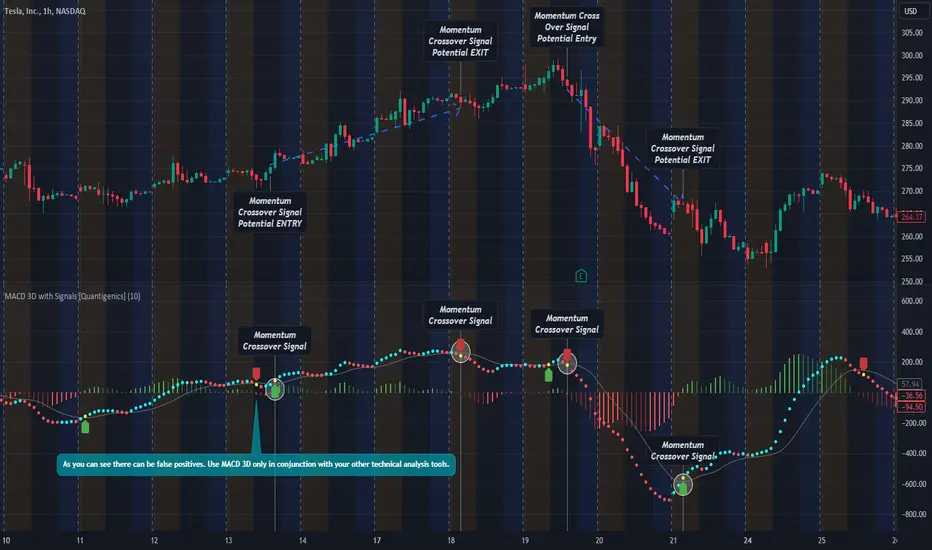
MACD 3D with Signals [Quantigenics]Quantigenics MACD 3D with Buy Sell Signals is a MACD-based trading indicator that aims to identify market trends and potential turning points, for Buy/Sell opportunities, by leveraging price data and volatility.
Unlike the traditional MACD indicator, the average price is calculated from the high, low, and close prices, from which a specialized MACD value is derived. This MACD value, combined with an average and standard deviation, takes into account volatility, and is used to generate an upper and lower boundary.
The indicator color-codes market trends: aqua indicates upward trends (signifying increased buying pressure), red suggests downward trends (increased selling pressure). When the MACD value crosses above the upper boundary or falls below the lower boundary, the color changes to yellow indicating a possible reversal point and "Momentum Crossover Signals" can be plotted at this point. "Standard Signal" arrows can also plotted when the MACD 3D changes from auqa to red and vice-versa.
A trendline is drawn at the median value, providing a baseline for comparison. A differential value, which measures the distance between the MACD value and the median line, provides additional insight into the price's deviation from this baseline (divergences from the underlying price can be spotted using this data as well). The differential is color-coded: green when MACD is above the median, and red when it's below, with darker shades representing a decreasing gap.
Alerts can be set to trigger with the "Standard Signal" arrows appearing after MACD 3D changes from auqa to red and vice-versa and when the "Momentum Crossover Signal" arrows appear when the MACD value crosses above the upper boundary or falls below the lower boundary indicating a potential reversal. Providing immediate notifications which can be especially helpful in larger time frames where it may take time for a trade setup to develop.
CME_MINI:NQ1!
OANDA:XAUUSD
Enjoy the MACD 3D indicator. Happy Trading!
Realized Profit & Loss [BigBeluga]The Realized Loss & Profit indicator aims to find potential dips and tops in price by utilizing the security function syminfo.basecurrency + "_LOSSESADDRESSES".
The primary objective of this indicator is to present an average, favorable buying/selling opportunity based on the number of people currently in profit or loss.
The script takes into consideration the syminfo.basecurrency, so it should automatically adapt to the current coin.
🔶 USAGE
Users have the option to enable the display of either Loss or Profit, depending on their preferred visualization.
Examples of displaying Losses:
Example of displaying Profits:
🔶 CONCEPTS
The concept aims to assign a score to the data in the ticker representing the realized losses. This score will provide users with an average of buying/selling points that are better to the typical investor.
🔶 SETTINGS
Users have complete control over the script settings.
🔹 Calculation
• Profit: Display people in profit on an average of the selected length.
• Loss: Display people in loss on an average of the selected length.
🔹 Candle coloring
• True: Color the candle when data is above the threshold.
• False: Do not color the candle.
🔹 Levels
- Set the level of a specific threshold.
• Low: Low losses (green).
• Normal: Low normal (yellow).
• Medium: Low medium (orange).
• High: Low high (red).
🔹 Z-score Length: Length of the z-score moving window.
🔹 Threshold: Filter out non-significant values.
🔹 Histogram width: Width of the histogram.
🔹 Colors: Modify the colors of the displayed data.
🔶 LIMITATIONS
• Since the ticker from which we obtain data works only on the daily timeframe, we are
restricted to displaying data solely from the 1D timeframe.
• If the coin does not have any realized loss data, we can't use this script.

Tri-State SupertrendTri-State Supertrend: Buy, Sell, Range
( Credits: Based on "Pivot Point Supertrend" by LonesomeTheBlue.)
Tri-State Supertrend incorporates a range filter into a supertrend algorithm.
So in addition to the Buy and Sell states, we now also have a Range state.
This avoids the typical "whipsaw" problem: During a range, a standard supertrend algorithm will fire Buy and Sell signals in rapid succession. These signals are all false signals as they lead to losing positions when acted on.
In this case, a tri-state supertrend will go into Range mode and stay in this mode until price exits the range and a new trend begins.
I used Pivot Point Supertrend by LonesomeTheBlue as a starting point for this script because I believe LonesomeTheBlue's version is superior to the classic Supertrend algorithm.
This indicator has two additional parameters over Pivot Point Supertrend:
A flag to turn the range filter on or off
A range size threshold in percent
With that last parameter, you can define what a range is. The best value will depend on the asset you are trading.
Also, there are two new display options.
"Show (non-) trendline for ranges" - determines whether to draw the "trendline" inside of a range. Seeing as there is no trend in a range, this is usually just visual noise.
"Show suppressed signals" - allows you to see the Buy/Sell signals that were skipped by the range filter.
How to use Tri-State Supertrend in a strategy
You can use the Buy and Sell signals to enter positions as you would with a normal supertrend. Adding stop loss, trailing stop etc. is of course encouraged and very helpful. But what to do when the Range signal appears?
I currently run a strategy on LDO based on Tri-State Supertrend which appears to be profitable. (It will quite likely be open sourced at some point, but it is not released yet.)
In that strategy, I experimented with different actions being taken when the Range state is entered:
Continue: Just keep last position open during the range
Close: Close the last position when entering range
Reversal: During the range, execute the OPPOSITE of each signal (sell on "buy", buy on "sell")
In the backtest, it transpired that "Continue" was the most profitable option for this strategy.
How ranges are detected
The mechanism is pretty simple: During each Buy or Sell trend, we record price movement, specifically, the furthest move in the trend direction that was encountered (expressed as a percentage).
When a new signal is issued, the algorithm checks whether this value (for the last trend) is below the range size set by the user. If yes, we enter Range mode.
The same logic is used to exit Range mode. This check is performed on every bar in a range, so we can enter a buy or sell as early as possible.
I found that this simple logic works astonishingly well in practice.
Pros/cons of the range filter
A range filter is an incredibly useful addition to a supertrend and will most likely boost your profits.
You will see at most one false signal at the beginning of each range (because it takes a bit of time to detect the range); after that, no more false signals will appear over the range's entire duration. So this is a huge advantage.
There is essentially only one small price you have to pay:
When a range ends, the first Buy/Sell signal you get will be delayed over the regular supertrend's signal. This is, again, because the algorithm needs some time to detect that the range has ended. If you select a range size of, say, 1%, you will essentially lose 1% of profit in each range because of this delay.
In practice, it is very likely that the benefits of a range filter outweigh its cost. Ranges can last quite some time, equating to many false signals that the range filter will completely eliminate (all except for the first one, as explained above).
You have to do your own tests though :)

EMA Envelope - Signal with Stoploss and Takeprofit LevelsDescription:
This Pine Script indicator implements the EMA Envelope strategy, which utilizes Exponential Moving Averages (EMA) to create an envelope around the price chart. The strategy generates buy and sell signals based on the crossing of the price above and below the upper and lower EMA envelopes, respectively. It also incorporates additional features such as stop-loss and take-profit levels for risk management.
Indicator Settings:
EMA Length: Specifies the period for the short-term Exponential Moving Average.
Long Term EMA Length: Defines the period for the long-term Exponential Moving Average used for signal filtering.
Take Profit Ratio: Determines the ratio for calculating the take-profit levels based on the stop-loss.
Filter Signal on Long Term EMA: Enables or disables the filtering of buy/sell signals using the long-term EMA.
Show only recent signal: When enabled, shows only the most recent buy/sell signals.
Buy and Sell Signals:
The indicator generates buy signals when the price crosses above the upper EMA envelope and the previous low was below the upper EMA envelope. Additionally, you can choose to filter buy signals based on whether the closing price is above the long-term EMA.
Conversely, sell signals are generated when the price crosses below the lower EMA envelope, and the previous high was above the lower EMA envelope. Similar to buy signals, sell signals can also be filtered using the long-term EMA.
Note: Signal works well on Higher Timeframes like Daily/8hrs/4hrs/1hr.
Stop-Loss and Take-Profit Levels:
For buy signals, the stop-loss is set at the lower EMA level, while the take-profit level is calculated by adding a specified ratio of the difference between the low and the stop-loss level to the low price.
For sell signals, the stop-loss is set at the upper EMA level, and the take-profit level is calculated by subtracting a specified ratio of the difference between the stop-loss level and the high price from the high price.
Disclaimer:
This indicator is provided for educational and informational purposes only. Trading involves significant risk, and past performance does not guarantee future results. Users are solely responsible for their trading decisions and should conduct their own research and risk management. The author shall not be held liable for any losses or damages arising from the use of this indicator.
Note: Always test the indicator thoroughly on historical data and consider paper trading before applying it to live trading environments.

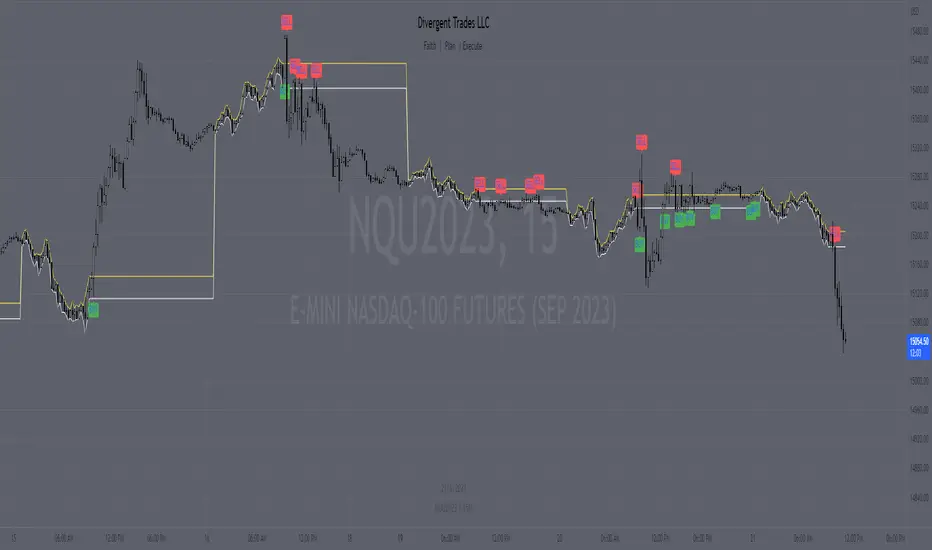
Range H/L Buy and Sell SignalThe "Range H/L Buy and Sell Signal" indicator is designed to identify potential buy and sell signals based on a specified price range and market volatility. This indicator can be used in the TradingView platform to assist traders in making informed decisions.
The indicator allows customization of several parameters to adapt to different trading strategies. These parameters include the start and end times for the price range, the volatility threshold, and the desired breakout conditions.
To begin, the indicator calculates the range start and end timestamps based on the provided hours and minutes. This defines the time period within which the indicator will analyze price movements.
Next, the indicator determines the highest high (High) and lowest low (Low) within the specified price range. These levels represent the upper and lower boundaries of the range and act as potential breakout points.
Volatility is also taken into account to filter out false signals. The indicator calculates the true range and the average true range over a period of 14 bars. The true range measures the price range from the current high to low, while the average true range provides an indication of market volatility.
Based on the breakout conditions and the volatility threshold, buy and sell signals are generated. A buy signal occurs when the closing price crosses above the High and the true range is greater than the volatility threshold multiplied by the average true range. Conversely, a sell signal is triggered when the closing price crosses below the Low and the true range exceeds the volatility threshold multiplied by the average true range.
The indicator visually displays the High and Low levels as plotted lines on the chart. Additionally, it marks the buy signals with green labels labeled "BUY" below the corresponding bars and the sell signals with red labels labeled "SELL" above the bars.
It is important to note that this indicator should be used in conjunction with other technical analysis tools and indicators for comprehensive market analysis. Trading always carries risks, and it is crucial to exercise caution and conduct thorough analysis before making any trading decisions.
Divergent Trades LLC:
Disclaimer: The information provided by the Divergent Trades LLC indicator is for educational and informational purposes only. It should not be considered financial advice or a recommendation to buy, sell, or trade any financial instrument. Divergent Trades LLC is not responsible for any losses incurred as a result of using this indicator. Trading in the financial markets carries a high level of risk and may not be suitable for all investors. Before making any investment decisions, please consult with a financial advisor and do your own due diligence. Past performance is not indicative of future results. By using the Divergent Trades LLC indicator, you acknowledge that you have read and understand this disclaimer and agree to its terms and conditions.
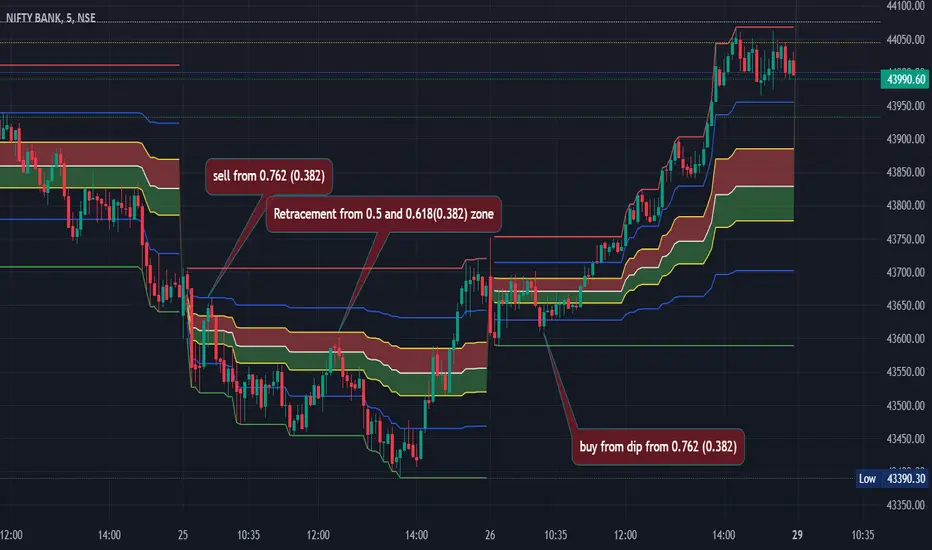
Custom Fib by Dr. MauryaThis indicator is based on purely Fibonacci levels.
How it works:
Let's first understand the Fibonacci levels.
The main Fibonacci numbers are 0, 0.236, 0.392, 0.5, 0.618, 0.764, 1 whereas 0 equal to low and 1 equal to high.
As the market is moving in any direction, new lows or new highs are developing and hence Fibonacci levels are also changing throughout the time.
Sometime market retraces from various levels like 0.5, 0.618/0.382(mirror value), 0.762/0.236 (mirror value).
Retracement : The three mid-level 0.382, 0.5 and 0.618 are act as a retracement or like pivot levels for market. These levels are filled with green and red colors to attention the buyers and sellers to take a trade either side if any candlestick pattern are observed at these levels.
one direction trend takes support of 0.236/0.786(mirror value) (blue line in chart)
Sometime buy/sell on dip levels are happen at 0.762/0.392 (mirror value).
Targets: Target could be Fibonacci extension level lowest targets (1, 1.18, 1.23,), medium targets (1.39, 1.5, 1.61) and large target (2.0, 2.5.2.61, 3.0) as depended on your study volume levels and trend strength.
Stoploss: You can choose any preceding lines for stoploss: e.g. if you enter long on 0.618 or 0.5 levels you can set SL on 0.762
Previous day three mid-point 0.382, 0.5, 0.618 (filled with red and green color) as well as high and low could also act as resistance or support levels for current day market.
Lets understand the Input section of indicator
The first input section allowed to choose where you want to start developing Fibonacci : select session for intraday then weekly, monthly and yearly options are available.
Now you can set any Fibonacci levels (as you wish) you can set upto 20 levels.
By default, total 7 Fibonacci levels are plotted (0, 0.236, 0.392, 0.618, 0.762 and 1.
Further you can set Fibonacci extension level for long side (1.18, 1.23, 1.39, 1.5, 1.61, 2 etc).
You must be careful when you enter Fibonacci extension level lower side (short side). You need to enter value -0.5 (equal to 1.5 for long). -0.618 (equal to 1.618 for long), -1(equal to 2.0 for long).
You can fill color between any two adjacent lines from style sections.
You can also select labels from input tab if you want to see Fibonacci numbers on chart as labels.
You can also shift the labels from current bar to desired offset bar by changing the value in input section.
Conclusion
This indicator is highly customisable developing Fibonacci levels because everyone and different scripts works on different fib levels.
This indicator keeps the Fibonacci levels at a particular time and it plots only new lines when new low or high established without affecting the previous Fibonacci levels. Overall, as the market moves, you will find the trending plot goes which side.
VWAP + 2 Moving Averages + RSI + Buy and SellIndicator: VWAP + 2 Moving Averages + RSI + Buy and Sell
Buy and Sell Arrows (Great for use alone or in conjunction with other scripts on the chart)
This indicator displays BUY (BUY) and SELL (SELL) arrows on the chart based on a combination of moving averages, VWAP and RSI. Arrows are a visual way to identify trading opportunities and can be useful for traders who want to follow a strategy based on these conditions.
The indicator uses two moving averages (20 and 50 periods) to identify upward crosses (buy) and downward crosses (sell). In addition, it takes into account VWAP (Volume Weighted Average Price) and RSI (Relative Strength Index) as additional filters to confirm buy and sell signals.
This script is great for use both independently and in conjunction with other indicators and strategies. You can combine it with other indicators and customize it to your preferences to create a more comprehensive trading strategy.
Please remember that this indicator is provided for educational purposes only and does not constitute financial advice. It is always recommended to carry out a thorough analysis before making any trading decisions.
Give this indicator a try and enjoy clear visualization of buy and sell arrows on your chart. Happy trading!

Inside candle (Inside Bar) Strategy- by smartanuThe Inside Candle strategy is a popular price action trading strategy that can be used to trade in a variety of markets. Here's how you can trade the Inside Candle strategy using the Pine script code provided:
1. Identify an Inside Candle: Look for a candlestick pattern where the current candle is completely engulfed within the previous candle's high and low. This is known as an Inside Candle.
2. Enter a Long Position: If an Inside Candle is identified, enter a long position at the open of the next candle using the Pine script code provided.
3. Set Stop Loss and Take Profit: Set a stop loss at a reasonable level to limit your potential losses if the trade goes against you. Set a take profit at a reasonable level to take profit when the price reaches the desired level.
4. Manage the Trade: Monitor the trade closely and adjust the stop loss and take profit levels if necessary. You can use the Pine script code to automatically exit the trade when the stop loss or take profit level is hit.
5. Exit the Trade: Exit the trade when the price reaches the take profit level or the stop loss level is hit.
It's important to note that the Inside Candle strategy is just one of many strategies that traders use to trade the markets. It's important to perform your own analysis and use additional indicators before making any trades. Additionally, it's important to practice proper risk management techniques and never risk more than you can afford to lose.

ASR_Top/BottomThis is top and bottom finder indicator which is using RSI , Mavilimw(Kivanc's) , BB and WT
it is better use this indicator on Daily Weekly and 4H chart
There is 2 signal Buy and Sell , you can use different strategies such as ( when you see Buy signal you can buy 25% of your portfolio and when you see SELL signal sell 25% of portfolio )
rule is basic :
Buy - when RSI and WT is in overbought zone and Last bar touched upper BB line and backed inside it would triggered buy
SELL- when RSI and WT is in oversold zone and last bar touched lower band of BB and up inside it would be triggered sell
Strategies :
it is better use this indicator also with RSI divergence
let say you see BUY signal and after that you see rsi positive divergence it is confirmed that we are in bottom or when Sell signal happened and rsi negative divergence happened it confirms that we are in top
also you can use 200 ma , if you see sell in below 200 ma it is exit opportunity or if you see buy above 200 ma it is buy opportunity
I would appreciate your comments and opinions or experiences when you are using this indicator

Trend Reversal System with SR levelsHello All,
This is the Trend Reversal System with Support/Resistance levels script. long time ago I published it as closed source but now I upgraded it and and published as open-source with a different name. I hope it would be useful for you all while trading/analyzing.
The script has some parts in it: Setup, Count, SR levels, Risk levels & Targets . Now lets check them:
Setup Part: it has two part, Buy or Sell Setup. one of them can be active only. Buy setup: if current close checks if current is lower/equal than the close of the 5. bar. if yes then the script increases number of buy setup. and if it reaches 9 then the script checks if current low is lower/equal than the lows of last 3. and 4. bars, or if the low of the last bar is lower/equal than the lows of last 3. and 4. bars. if yes then the script increases the buy setup by 1. if these conditions met then it puts the label 'S' , same for Sell setup. S labels on both setup are potential reversals.
Count Part: If buy or sell setup reaches the 9 then Count part starts from 1. lets see buy count: If current close is lower/equal than the low of the 3. bar and buy count is lower than 12 or low of the bar 13 is less than or equal to the close of bar 8 then buy count increase or it's completed. if it's completed then the script puts C label, and it's potential reversal. of course there are some conditions that can cancel the count buy/sell or recycle/restart.
By using Setup and Count levels the script can show Support/Resistance Levels, Risk levels & Targets. SR levels are potential reversal levels.
Lets see some example screenshots:
Support/Resistance levels:
Potential Reversal levels and how setup/counts are shown:
Count part can recycle and the script shows it as 'R' , ( you can see the conditions for Recycle in the script ):
Count can be cancelled and and it's shown as 'x'
If the scripts find 9 on Setup or 13 on Count then it checks if it's a good level to buy/sell and if it decides it's good level then it shows TRSSetup Buy/Sell or TRSCount Buy/Sell and also shows the target. in following example the script checks and decide it's a good level to take long position. it can be aggressive or conservative, Conservative is recommended.
Enjoy!

SynthSAR ConfirmationThis indicator represents confirmation of a trend based on the PSAR indicator and includes signals from the MACD, stochastic oscillator, and awesome oscillator. It displays the points of the parabolic SAR on the chart, which help determine the direction of the trend. Additionally, the indicator allows for tracking signals based on the combined analysis of three other technical indicators: MACD, stochastic oscillator, and awesome oscillator. Furthermore, the indicator includes the ability to display buy/sell labels and signals for changing the trend direction. This is not an investment recommendation.Very effective in higher timeframes.If the MACD "macd line" crosses the "signal line" from above and the Stochastic %K line crosses the %D line from above, and the last column in the Avesome Oscillator is red, then the indicator gives a signal to sell. If the MACD "macd line" crosses the "signal line" from below and the Stochastic %K line crosses the %D line from below, and the last column in the Avesome Oscillator is green, then the indicator gives a signal to buy.

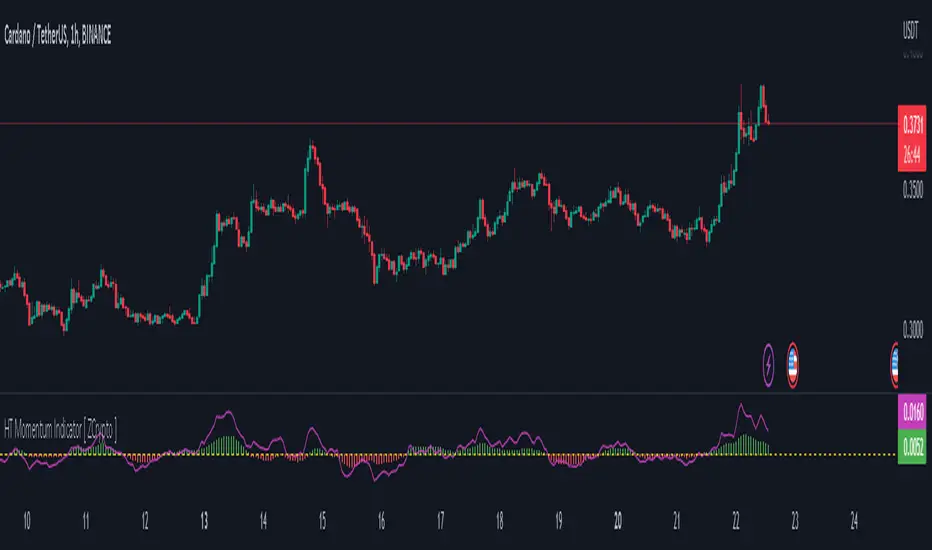
HT Momentum Indicator [ ZCrypto ]
The HT Momentum Indicator is a technical analysis tool that uses the Hyperbolic Tangent (tanh) function to measure momentum in a trading instrument.
This indicator is plotted as a histogram, with positive values indicating bullish momentum and negative values indicating bearish momentum.
Here are the main features and settings of the HT Momentum Indicator:
Source: This setting allows you to choose the price data used to calculate the momentum indicator. By default, the indicator uses the (High+Low+Close)/3 price, but you can select other options such as the open, high, or low prices.
Period: This setting determines the number of periods used in the momentum calculation. By default, the indicator uses a period of 14, but you can adjust this to suit your trading style and the market you are trading.
Show Fast/Slow/VWAP: These settings allow you to choose whether or not to display the fast and slow exponential moving averages (EMAs) and the volume-weighted average price (VWAP) on the chart.
Fast Length/Slow Length/VWAP Length: These settings allow you to adjust the length of the fast and slow EMAs and the VWAP calculation.
Bull Color/Bear Color: These settings allow you to choose the colors for the bullish and bearish histograms.
Zero Line: This indicator also includes a horizontal line at the zero level to help you identify when momentum is transitioning from bullish to bearish or vice versa.
The HT Momentum Indicator can be used to identify trends, momentum shifts, and potential buy/sell signals.
you can use the fast and slow EMAs to identify short-term and long-term trends, respectively, and the VWAP to gauge the strength of buying or selling pressure.
Additionally, the HT Momentum Indicator includes four pre-programmed alert conditions, which can notify you
when the fast EMA crosses above the slow EMA,
when the VWAP crosses above the zero line,
when the histogram transitions from negative to positive values.
when the histogram transitions from negative to positive values and VWAP above zero line
SumIndTarget:
The SumInd indicator combines Heiking Ashi, Sar Parabolic, Koncord, RSI, DMI, MACD and Bollinger Bands to give buy or sell signals or trends. This are called base indicators.
The goal is to have a clear and quick buy or sell suggestion and to avoid evaluating all or some of the named indicators, especially if they give contradictory signals among them. This speed and simplicity helps the trader to see several tickers in less time. It is intended for all markets and time periods where the above-mentioned indicators can be used.
How it works:
SumInd already has the importance or "weight" of each indicator named above configured, but they can be modified. You can set 0% for no use, or any other value based on the weight you want to give it, between 1% and 200% where 100% is the normal use, and increases or decreases based on importance.
Each base indicator can give signals to buy, sell or just "wait and see".
Each base indicator is checked for a buy signal, in which case its weight is added to the positive or green line, and if there is a sell signal, its weight is subtracted from the sell or red line. in case of indeterminacy or 'wait and see', nothing is added to any signal.
The yellow or total line is the sum of the buy or green signal plus the sell or red signal.
If the yellow or total line rises above the buy level, the background changes to green and an up arrow appears at the bottom of the chart indicating the buy suggestion, because most of the indicators you are interested in gave a buy signal.
If the yellow line or total falls below the sell level, the background changes to red and a downward arrow appears in the upper area of the chart indicating the sell suggestion, because most of the indicators you are interested in gave a sell signal.
The Buy and Sell level can be changed according to the security of the suggestion you need.
Areas without arrows or marks are considered "wait and see" areas, the previous trend in principle continues. They can be marked with the default background if desired from the SumInd settings.
Details and criterials:
Each of the following indicators can be turned on or off and assigned different weights of importances, by whether or not it shares the following criteria:
Heikin Ashi candles: add or subtract half an assigned weight if there is a buy or sell candle and the other half weight if there are two consecutive candles with the same signal.
RSI: Adds or subtracts the assigned weight if the ema is below or above the signal.
Parabolic Sar: Adds half a weight in transition to buy or sell and another half weight if there are two consecutive signals of the same trend.
Koncord: Add or subtract the weight if the current trend (mountain) grows or decreases respectively from the 4th previous time signal, and also the value (red line) is less than 35 or exceeds 65 respectively.
DMI: Adds or subtracts a quarter of the weight assigned by the DMI signal multiplied by the value of DMI, if the positive or negative signal exceeds the other negative or positive signal by 15% respectively.
Bollinger Bands: Add or subtract the weight if the previous third signal touches or falls out of the zone and keeps growing or decreasing respectively.
MACd: Add or subtract one third of the weight if the last 3 time signals are rising or falling, Add or subtract another third if the fast signal is above or below the slow signal, and Add or subtract the last third of the weight if it is rising with the negative fast signal, or falling with the positive fast signal.
